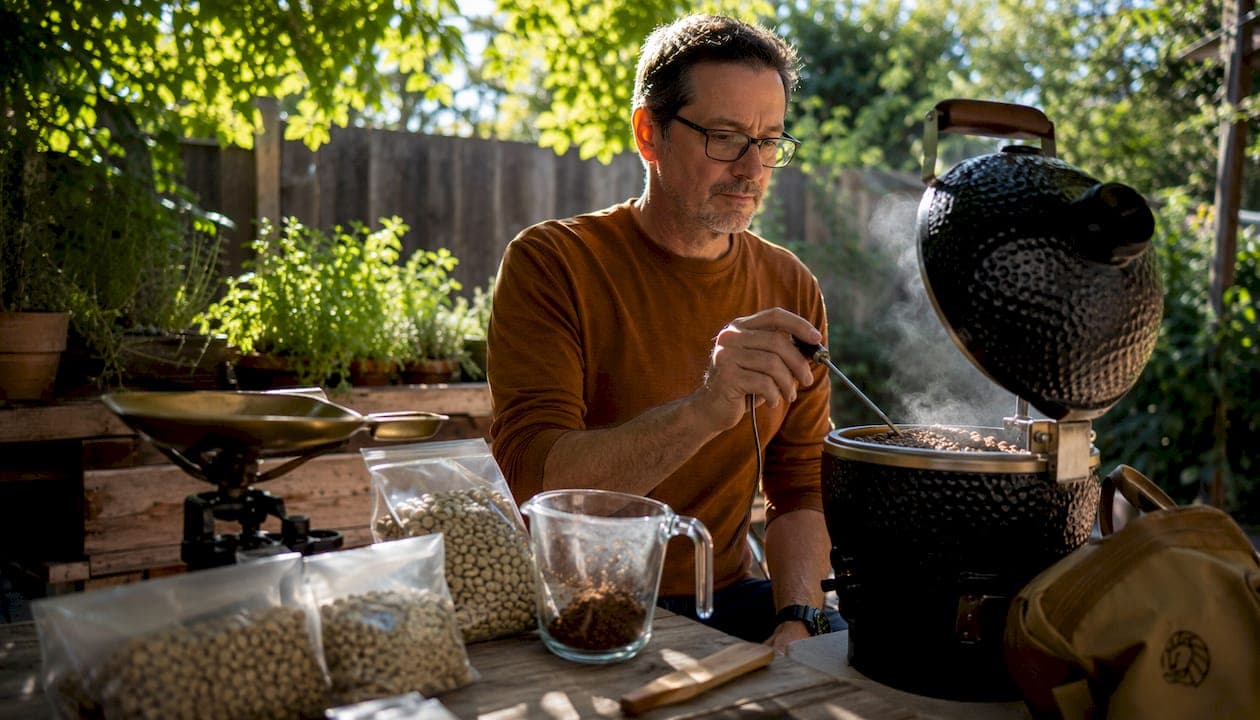
A roast profile is the time-versus-bean-temperature plan that governs how a coffee's sugars, acids, and aromatics develop from raw green bean to finished cup. Every flavor decision you make as a roaster, whether you want a bright Ethiopian Yirgacheffe or a chocolatey Brazilian natural, is encoded in that curve. The single best place to start is by logging bean temperature throughout the roast, noting the moment first crack begins, and computing your development time ratio (DTR). Those data points, combined with the Maillard reaction and caramelization milestones that happen along the way, give you a repeatable foundation to build on.
Table of Contents
- What core metrics define a coffee roasting profile?
- The chronological stages of a roast and what each one does
- How roast profile choices shape what you taste in the cup
- What variables can you actually control to reshape the curve?
- How to design, run, and iterate a roast profile at home
- Tools and software that make profiling practical for home roasters
- Development time ratio: the control metric that matters most
- Common roast profile problems and how to fix them
- Key Takeaways
- Why systematic experimentation beats chasing the perfect profile
- Deepen your knowledge with Lyons Den Publishers
- Useful sources and further reading
What core metrics define a coffee roasting profile?
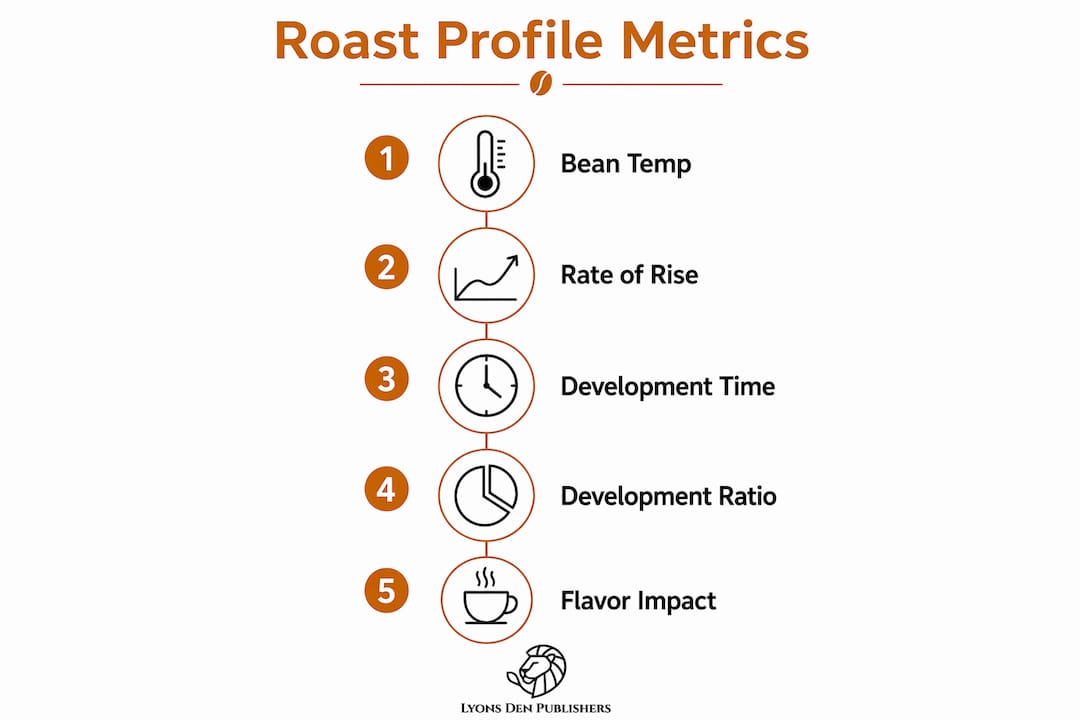
A roast profile is only as useful as the data behind it. Logging the right measurements turns a one-time roast into a repeatable recipe.
Bean temperature (BT) is the primary reading. A thermocouple or thermistor probe sits in the bean mass and reports temperature in real time. Probe placement matters: a probe too close to the drum wall reads drum temperature, not bean temperature, which inflates early readings and masks the true turning point. Most home drum roasters position the probe so it contacts the rolling bean mass directly.
Rate of rise (RoR) is the first derivative of the BT curve, expressed in °F/min or °C/min. A declining RoR throughout the roast is generally desirable in specialty roasting. A sudden crash in RoR produces baked, flat flavors; a sharp upward flick near the end can introduce harsh bitterness.
Development time (DT) and development time ratio (DTR) measure what happens after first crack. DT is the elapsed time from first crack to drop; DTR is DT divided by total roast time, expressed as a percentage. A DTR of 20–25% is a common starting target for medium roasts, though the ideal range shifts with bean density, processing method, and roaster type.
Color and visual cues complement temperature data. The Agtron scale assigns a numeric value to roasted bean color, with higher numbers indicating lighter roasts. Without an Agtron meter, surface color, oil presence, and bean expansion offer useful cross-checks.
Weight loss (the difference between green and roasted weight) typically runs 12–20% depending on roast level. Heavier weight loss correlates with darker development and more moisture and CO₂ driven off.
Statistic callout: Multiple sensory indicators — BT, color, smell, RoR, and sound — are recommended over any single metric because no one reading reliably determines roast stop.
The chronological stages of a roast and what each one does
Understanding the sequence of events inside the drum helps you predict and control the flavors that end up in the cup. The table below maps each phase to its typical temperature range, duration, and sensory consequence in a specialty roast.
| Stage | Typical BT Range | Approx. Duration | What Happens | Sensory Impact |
|---|---|---|---|---|
| Charge / Turning point | Drum ~350–450°F; BT drops briefly | — | Green beans absorb drum heat; BT falls to turning point before rising | Sets early heat trajectory |
| Drying | ~212–300°F (100–150°C) | 1:30–4:00 | Free and bound moisture evaporates; beans turn yellow-green | Grassy, hay-like aromas |
| Maillard / Browning | Mid-temperature range | 4:00–8:00 | Maillard reaction and Strecker degradation produce hundreds of aroma compounds | Bread, caramel, nutty notes develop |
| First crack | High mid-temperature range | ~8:00–10:00 | Exothermic reaction; beans crack audibly as CO₂ and steam escape | Acidity peaks; sweetness begins |
| Development | High temperature range | 1:00–3:00 post-crack | Caramelization and continued Maillard; DTR accumulates | Sweetness, body, and complexity build |
| Second crack | Very high temperature range | Variable | Cell walls fracture again; oils migrate to surface | Roasty, smoky, bittersweet |
| Drop / Cooling | Target: ≤3–5 min cooling | Immediate | Heat application stops; beans must cool rapidly | Preserves intended roast level |
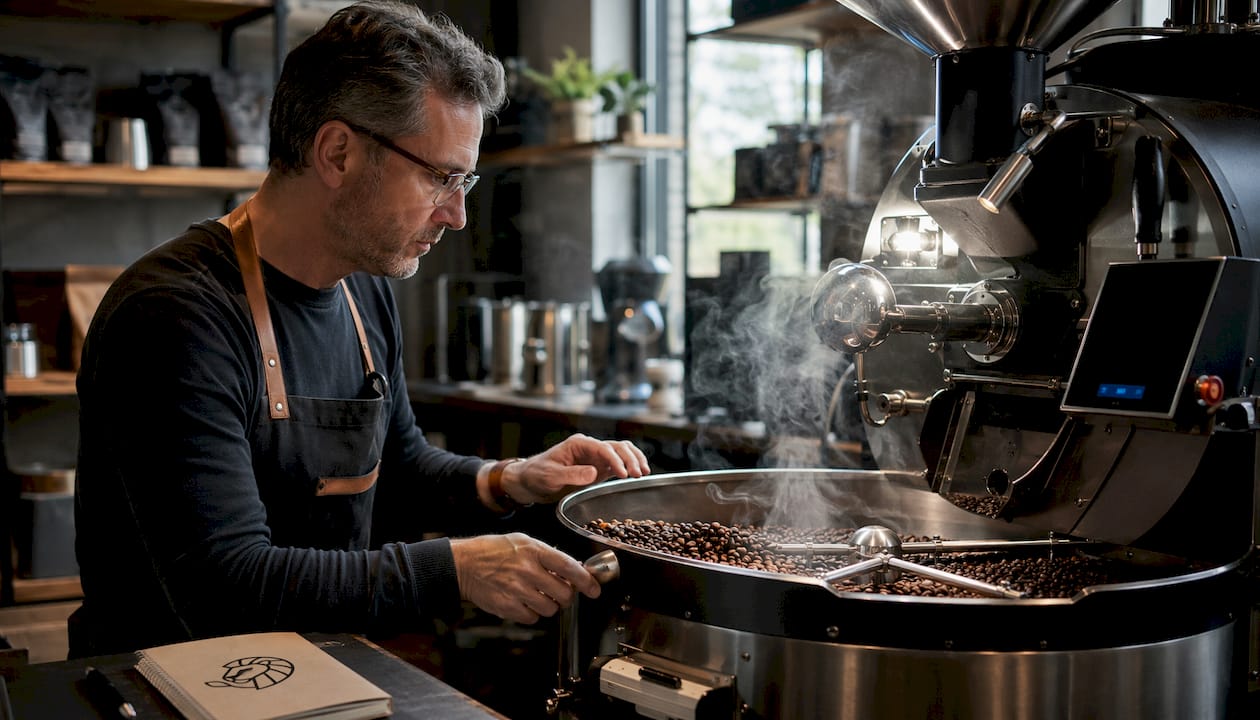
A typical specialty roast lasts 8–14 minutes total. Roasts shorter than 8 minutes risk underdevelopment; those stretching past 14 minutes often produce baked, lifeless cups. The Maillard phase is where most of a coffee's aromatic complexity is built, which is why experienced roasters pay close attention to heat application during that window.
First crack is both a chemical and an audible event. Despite the precision of modern logging software, audible first crack remains a primary indicator because probe latency and environmental differences between roasters mean temperature readings can lag the actual bean state by several seconds.
How roast profile choices shape what you taste in the cup
Every decision you make on the curve translates directly into a sensory outcome. The relationship is not always linear, but the patterns are consistent enough to use as design tools.
- Faster RoR and higher final temperatures push development toward roast-derived flavors: chocolate, caramel, smoke, and bitterness. Darker roasting masks delicate origin notes and produces bittersweet, smoky profiles.
- Longer Maillard phase with moderate heat builds sweetness and body. A roast where the browning phase runs 5–6 minutes at a controlled RoR tends to produce a fuller, more rounded cup.
- Short DTR (under 15%) leaves the bean underdeveloped: bright, sharp acidity with a thin body and sometimes a grassy or astringent finish.
- Higher DTR (20–25%) increases sweetness and rounds acidity without pushing into roast-forward territory, which is why it is a common target for medium specialty roasts.
- Extended development beyond 25–30% begins to flatten acidity and introduce more roast character, eventually trending toward bitterness.
Origin and processing interact with these choices in meaningful ways. A washed Ethiopian with delicate floral and citrus notes needs a gentle Maillard phase and a conservative DTR to preserve those volatile aromatics. Push the heat too aggressively and the florals vanish. A dense, naturally processed Brazilian, by contrast, carries more inherent sweetness and body, tolerating a slightly longer development without losing its character. Honey-processed coffees sit between the two: they have the fruit-forward sweetness of a natural but the cleaner structure of a washed bean, and they respond well to a medium-length Maillard phase.
Roast level is ultimately a subjective flavor decision, not an objective quality grade. Light is not inherently better than dark; they are different expressions of the same bean, each suited to different brew methods and preferences.
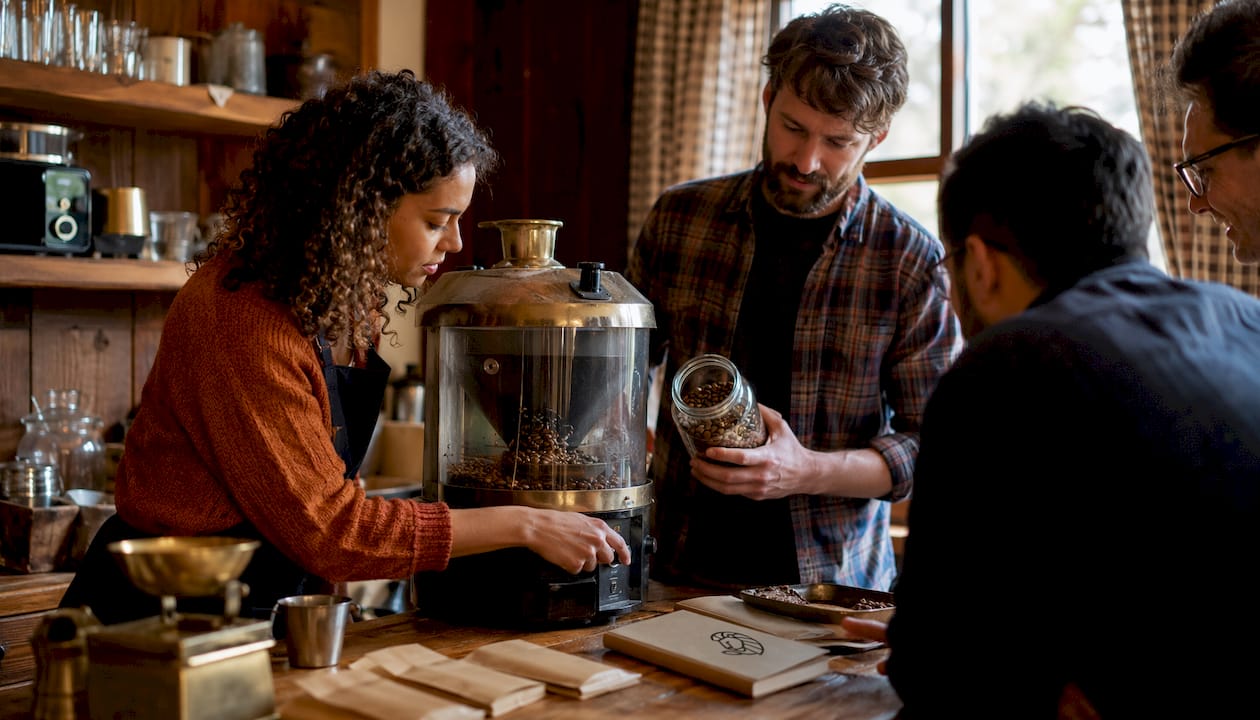
Pro Tip: When working with a new origin, roast three small batches to light, medium, and medium-dark, then cup them side by side. The comparison reveals which roast level best expresses that bean's character far faster than any single roast will.
What variables can you actually control to reshape the curve?
Home roasters work with a smaller set of controls than commercial operators, but those controls are sufficient to shape the curve meaningfully.
Charge temperature is the drum temperature at the moment beans are loaded. A higher charge temperature produces a faster early RoR and a more aggressive turning point. Lowering the charge temperature slows the early curve, which can extend the Maillard phase and build more sweetness, though it also risks a flat, underpowered roast if not managed carefully.
Heat application strategy is the most influential variable throughout the roast. Applying high heat early accelerates the Maillard phase but risks scorching the bean surface before the interior develops. A gentler, progressive heat application allows more even development. The turning point after charging is a critical moment: it marks when heat transfer shifts from the drum to the bean mass, and managing heat around that transition sets the trajectory for the entire roast.
Airflow controls how quickly combustion gases and moisture are evacuated from the drum. Higher airflow cools the bean environment and speeds surface reactions; lower airflow retains heat and slows the curve. Many home drum roasters use a fan-off strategy during the Maillard phase to build heat, then increase airflow during development to manage RoR.
Batch size affects heat transfer directly. A larger batch absorbs more drum heat and slows the RoR; a smaller batch heats faster and is more susceptible to scorching. Staying within the roaster's recommended batch range is the simplest way to maintain consistency.
Equipment type shapes what is possible. A popcorn popper offers minimal control beyond on/off timing. An air roaster provides better airflow management but limited drum contact. A home drum roaster, even a small one, gives the most control over charge temperature, heat application, and airflow. Small commercial drum roasters extend that control further with precise gas burner adjustment and variable drum speed.
Pro Tip: Make one small, deliberate change per roast session. Adjusting charge temperature, heat application, and airflow simultaneously makes it impossible to know which variable drove the result.
How to design, run, and iterate a roast profile at home
A repeatable workflow is what separates a home roaster who improves from one who produces inconsistent results indefinitely.
The planning and execution sequence
- Choose your green bean and flavor target. Decide whether you want to highlight origin character (lighter roast, shorter DTR) or develop sweetness and body (medium roast, longer Maillard).
- Set initial parameters. Pick a charge temperature appropriate for your roaster and batch size. For most home drum roasters, a moderate charge temperature is a reasonable starting point.
- Preheat thoroughly. Allow the drum to stabilize at charge temperature before loading beans.
- Charge and log immediately. Start your timer and begin recording BT and RoR from the moment beans enter the drum.
- Manage heat through the Maillard phase. Watch RoR and keep it declining gradually. Avoid large, sudden heat changes.
- Listen and log first crack. Note the exact time first crack begins. This is your DT start point.
- Decide your drop point. Count forward from first crack to hit your target DTR. For example, a two-minute development time for a ten-minute roast is typical.
- Drop and cool immediately. Transfer beans to a cooling tray and agitate continuously. Rapid cooling halts development and preserves the intended roast level.
- Record everything. Log charge temp, first crack time, drop time, total time, DTR, and any sensory notes from the warm bean smell.
- Cup after a day or two. Rest allows CO₂ to off-gas. Cup against your flavor target and note what to adjust.
- Change one variable. Adjust charge temperature, heat application, or DTR by a small increment and repeat.
Pro Tip: Split a batch in two and roast each half to a slightly different DTR. Cupping them side by side on the same day is the fastest way to understand how development time changes the cup.
Sample starting guidance
Profiles include light, medium, and medium-dark with total times around 9 to 13 minutes and development time ratios progressively increasing. Use these as starting points, not fixed recipes. Bean density, moisture content, and roaster calibration all shift roast duration and flavor outcomes. Use them as a baseline, cup carefully, and adjust from there. For a deeper look at how light vs. dark roast profiles differ in practice, the comparison is worth reading alongside these starter profiles.
Tools and software that make profiling practical for home roasters
Logging a roast by hand with a stopwatch and a thermometer is possible, but purpose-built tools make the process far more reliable and easier to analyze.
| Tool Category | What It Does | Practical Notes |
|---|---|---|
| Thermocouple (Type K) | Measures BT in real time | Probe placement is critical; avoid drum-wall contact |
| Thermistor probe | Faster response than thermocouple | Common in smaller home roasters |
| Data logger / USB interface | Converts probe signal to computer-readable data | Required for software-based logging |
| Roast-logging software | Plots BT and RoR curves; calculates DTR automatically | Desktop and tablet versions available |
| Mobile logging apps | Simplified curve tracking on a phone | Useful for air roasters and popcorn poppers with limited connectivity |
| Infrared thermometer | Spot-checks bean surface temperature | Not a substitute for continuous BT logging |
The turning point deserves special attention in any logging setup. After charging, the probe reads a temporary drop as cold beans absorb heat from the drum. This low point is the turning point, and it is not the same as charge temperature. Confusing the two is a common source of inconsistency: the turning point tells you how quickly the bean mass is absorbing heat, which predicts the early RoR trajectory.
When reading a raw RoR curve, three shapes matter most. A smoothly declining RoR from peak to drop is the target. A sudden crash, where RoR drops sharply mid-roast, usually signals a heat reduction that was too large or too late, and it often produces baked flavors. A flick, where RoR rises sharply near the end, typically means heat was increased too late in development and can introduce harsh, astringent notes.
Back up your roast logs after every session and use a consistent naming convention: bean origin, processing method, roast date, and batch number. Six months of logs become a genuinely useful reference when you are troubleshooting a problem or trying to replicate a roast that worked well.
Development time ratio: the control metric that matters most
DTR is the single most useful number for controlling roast flavor in a repeatable way. The formula is straightforward:
DTR (%) = Development Time ÷ Total Roast Time × 100
A worked example: if first crack begins at 8:30 and you drop the beans at 10:30, development time is 2:00. Total roast time is 10:30. DTR = 2 ÷ 10.5 × 100 = 19%.
The DTR is a vital metric that directly influences acidity, sweetness, and bitterness, and specialty roasters use it as a practical control metric across different bean lots and roaster types.
| DTR Range | Typical Sensory Profile | Notes |
|---|---|---|
| Under 15% | Sharp acidity, thin body, possible grassiness or astringency | Underdeveloped; rarely desirable |
| 15–20% | Bright acidity, light body, floral and fruit notes prominent | Suitable for delicate light roasts |
| 20–25% | Balanced acidity and sweetness, medium body, clean finish | Common target for medium specialty roasts |
| 25–30% | Lower acidity, fuller body, more sweetness and caramel | Medium-dark; good for espresso blends |
| Above 30% | Roast-forward, bittersweet, low acidity | Approaching dark roast territory |
To move DTR up, extend development time by dropping later or reducing heat slightly after first crack to slow the curve. To move DTR down, drop earlier or apply a small heat increase just before first crack to accelerate the final phase without extending time.
Statistic callout: DTR is a control metric, not a strict rule. Bean density, moisture content, and processing method all shift the ideal range. A dense, high-altitude washed coffee may need a DTR of 22% to taste fully developed, while a low-density natural from the same region might taste baked at the same number.
Common roast profile problems and how to fix them
Most roast defects leave a clear signature in both the cup and the roast log. Matching the sensory symptom to the curve cause is the fastest path to a fix.
| Defect | Sensory Signs | Likely Cause | Fix |
|---|---|---|---|
| Underdeveloped | Grassy, astringent, sharp raw acidity | DTR too low; total time too short | Extend development time; increase DTR to 20–25% target |
| Baked | Flat, dull, cardboard-like, low sweetness | RoR crash mid-roast; heat reduced too early or too much | Maintain smoother heat application; avoid large heat reductions |
| Scorched / Tipping | Burnt tips on beans; harsh, acrid bitterness | Charge temperature too high; early RoR too aggressive | Lower charge temperature by 10–15°F; reduce initial heat |
| Overdeveloped | Bitter, smoky, ashy, thin body | DTR too high; total time too long | Drop earlier; reduce development time |
| Roasty but flat | Chocolate and smoke without sweetness | Second crack reached unintentionally | Drop before second crack; reduce heat in development phase |
Before every roast session, run a short pre-roast checklist: confirm probe placement and calibration, verify batch weight is within the roaster's recommended range, and check that the cooling mechanism (tray fan or chaff collector) is operating correctly. A cooling failure that extends cooling beyond 3–5 minutes will bake the roast regardless of how well the curve was managed.
Tipping, the burning of bean tips, is one of the most common defects in home roasting and almost always traces back to an overly aggressive early RoR. The fix is simple: lower the charge temperature or reduce heat in the first two minutes. The bean surface cannot absorb heat faster than the interior can conduct it, and forcing the pace scorches the outside before the inside develops.
Key Takeaways
A roast profile's development time ratio, combined with a declining rate of rise and rapid post-roast cooling, is the most reliable framework for producing consistent, flavorful specialty coffee at home.
| Point | Details |
|---|---|
| Log BT and RoR every roast | Consistent data logging is the foundation of repeatable profiles and meaningful improvement. |
| Target DTR 20–25% for medium roasts | This range reliably produces balanced acidity and sweetness; adjust up or down based on origin and processing. |
| Cool within 3–5 minutes | Delayed cooling allows carryover heat to bake the roast and flatten aromatics. |
| Change one variable at a time | Adjusting charge temperature, heat application, or DTR simultaneously makes root-cause analysis impossible. |
| Match roast level to brew method and origin | Light roasts suit pour-over and filter methods; darker roasts work well for espresso and immersion brewing. |
| Lyons Den Publishers | The Complete World of Coffee covers roasting science, sensory evaluation, and profile development in depth for enthusiasts and professionals. |
Why systematic experimentation beats chasing the perfect profile
The most persistent mistake home roasters make is treating a published profile as a destination rather than a starting point. A DTR of 22% on a washed Kenyan AA from one roaster will not produce the same cup on a different machine with a different batch size and a probe positioned two centimeters differently. The numbers are a language for describing what happened, not a formula that guarantees a result.
What actually works is building a personal reference library through systematic tasting. Roast the same bean three ways, cup them blind, and record which sensory attributes shift with each profile change. Over time, the relationship between the curve and the cup becomes intuitive. The science of coffee roasting confirms what experienced roasters already know: no single metric, not DTR, not RoR, not color, tells the whole story. The cup does.
Patience with the process matters as much as technical precision. A roaster who cups every batch, adjusts one variable, and keeps honest notes will outperform one who chases the ideal profile without tasting. The best roasting profiles are the ones you build yourself, one carefully logged batch at a time.
Deepen your knowledge with Lyons Den Publishers
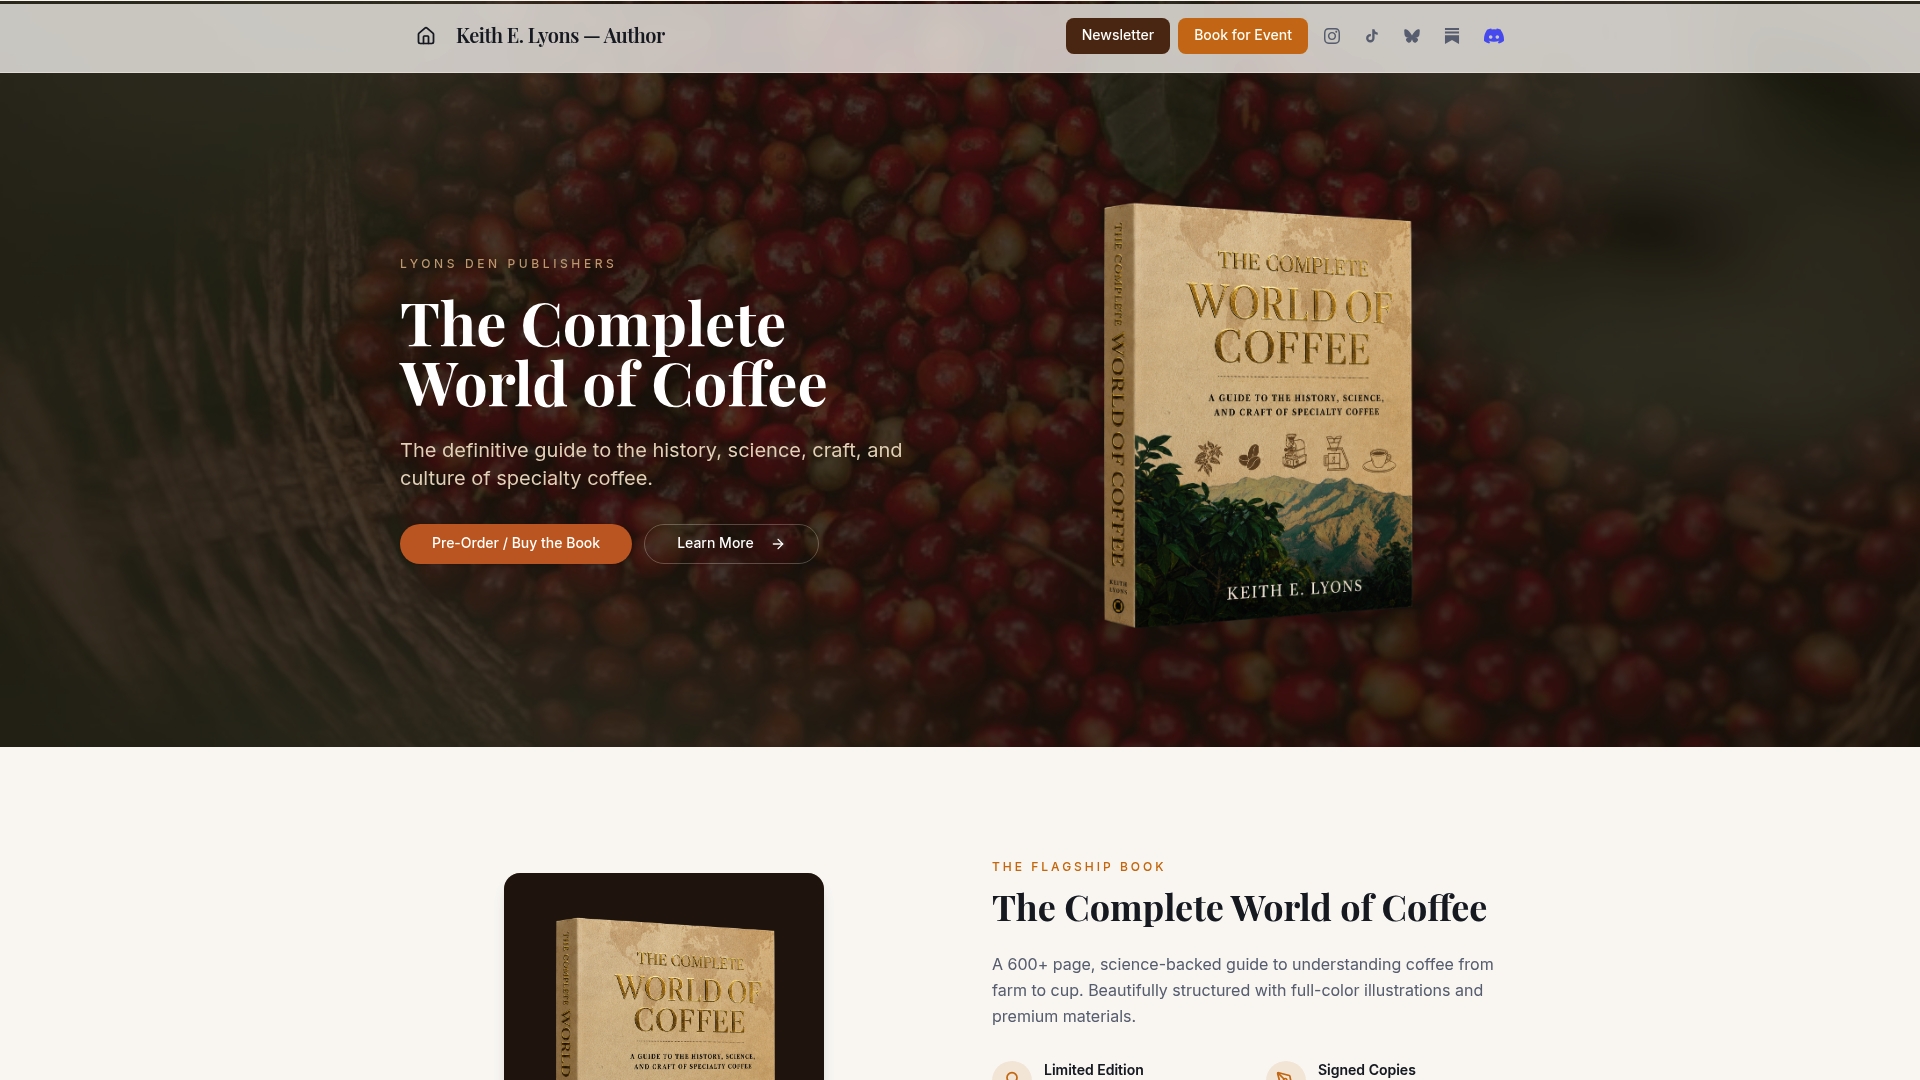
Roasting profiles sit at the intersection of chemistry, sensory science, and craft, and understanding them fully means understanding the bean before it enters the drum. The Complete World of Coffee by Keith Lyons covers the full arc from cultivation and coffee processing methods through roasting chemistry, sensory evaluation, and brewing science in a single authoritative reference.
For readers who want to go further, the Coffee Science section at Lyons Den Publishers covers roasting chemistry, Maillard reaction science, and sensory analysis in depth. Whether you are building your first profile or refining an established approach, the resources there provide the scientific grounding that makes practical experimentation more productive. For those interested in how processing choices shape what is possible in the roaster, the best roasting book recommendations on the site are a practical next step.
Useful sources and further reading
The following sources provide authoritative reference material on roasting science, roast levels, and profile development:
- Coffee Roasting Fundamentals, BrewFYI — practical treatment of RoR, DTR, and roast phases used by specialty roasters.
- Roasting Coffee Basics, CoffeeNavigated — accessible guide covering the turning point, probe variability, and multi-indicator evaluation.
- Coffee Roast Levels Field Guide, Pulled Journal — six-level temperature band reference from light (~356–401°F) to very dark.
- Ultimate Guide to Coffee Roasting, SpecialityCoffee.ca — covers origin character preservation and the light-versus-dark flavor spectrum.
- Coffee Roasting, Wikipedia — broad reference covering roast chemistry, color grading, and historical context.
- Coffee Roast Levels, National Coffee Association — consumer-facing overview of light, medium, and dark roast characteristics.
- Coffee Science Topics, Lyons Den Publishers — in-depth coverage of roasting chemistry, sensory analysis, and brewing science.
- Coffee Processing Methods, Lyons Den Publishers — reference hub on washed, natural, honey, and pulped natural processing and their influence on roast strategy.