A coffee extraction chart is a graphical tool that maps total dissolved solids (TDS) against extraction yield (EY) to show whether a brew falls within a balanced, flavorful range. The Specialty Coffee Association’s Brewing Control Chart, originally developed in the 1950s by Dr. E.E. Lockhart at MIT, replaced vague tasting notes with measurable variables. That shift gave brewers a shared scientific language. Recent research now challenges the single “ideal zone” concept, showing that consumer preferences cluster across a wider range than the traditional Gold Cup standard suggests. Understanding this chart is the fastest way to diagnose why a cup tastes flat, bitter, or weak.
What is a coffee extraction chart and what does it measure?
The coffee extraction chart plots two variables: TDS on the vertical axis and extraction yield on the horizontal axis. Diagonal lines crossing the chart represent brew ratios, the proportion of dry coffee to water by weight. Every brew you make lands at a specific point on this grid, and that point tells you exactly what went right or wrong.
TDS measures coffee strength, expressed as a percentage of dissolved solids in the final cup. A filter coffee at 1.2% TDS contains 1.2 grams of dissolved material per 100 grams of liquid. Higher TDS means a stronger, more concentrated cup.
Extraction yield (EY) measures how much of the dry coffee grounds actually dissolved into the water, also expressed as a percentage. The formula is straightforward: divide beverage weight multiplied by TDS by the dry coffee dose. A brew yielding 20% EY means 20% of the coffee’s dry mass ended up in the cup. The remaining 80% stayed in the grounds as insoluble fiber and undissolved compounds.
Brew ratio is the coffee-to-water proportion. A 1:16 ratio means 1 gram of coffee for every 16 grams of water. On the chart, each diagonal line represents a fixed ratio. Moving along that line changes both TDS and EY together. Shifting to a different diagonal changes the ratio itself.
These three variables are mathematically linked. Change one and the others shift. Brew a stronger cup by using more coffee (lower ratio number), and TDS rises while EY may stay the same. Brew longer with the same dose and water, and EY climbs while TDS follows. This interdependence is why the chart is so useful: it shows all three relationships at once.
-
Fix your brew ratio first. Choose a ratio that matches your desired cup strength before touching grind size.
-
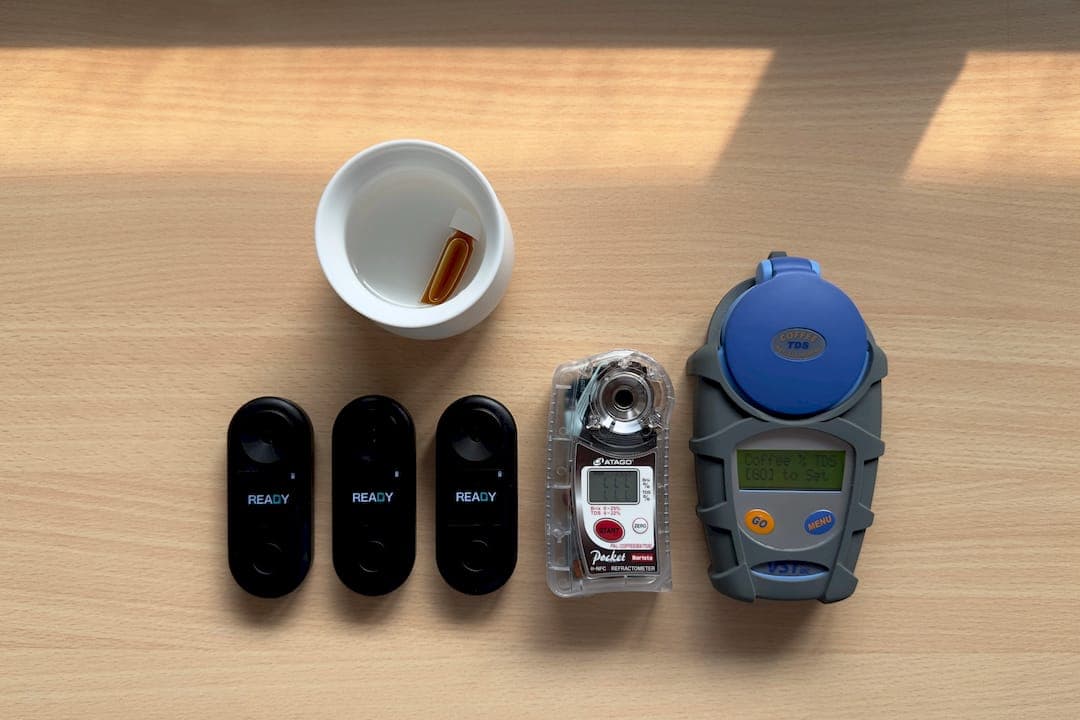
Measure TDS with a refractometer. This gives you the y-axis coordinate.
-
Calculate EY from the formula. This gives you the x-axis coordinate.
-
Plot the point. Your brew’s location on the chart tells you what to adjust.
Pro Tip: Experienced practitioners recommend selecting brew ratio first, then adjusting grind size. Multiple grind and brew time combinations can reach the same extraction yield, so locking in ratio before dialing grind prevents chasing two variables at once.
How do you read the chart to diagnose extraction problems?
The traditional Gold Cup standard sets the ideal filter coffee zone at 18–22% EY and 1.15–1.45% TDS. Brews landing inside this rectangle tend to taste balanced, with sweetness, acidity, and body in proportion. Brews outside it show predictable flaws.
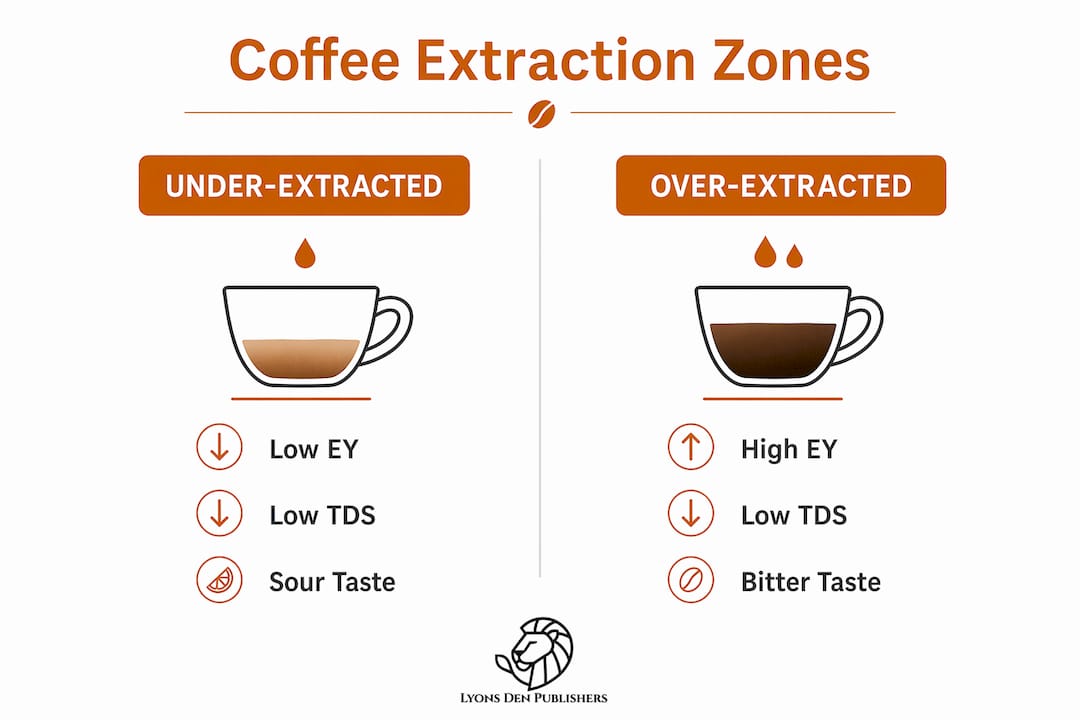
The chart divides into four practical quadrants around the ideal zone. Each quadrant corresponds to a specific sensory problem and a specific brewing cause.
| Chart position | Flavor character | Primary cause |
|---|---|---|
| Low EY, low TDS | Thin, sour, grassy | Under-extracted, weak dose |
| Low EY, high TDS | Sour, sharp, dense | Under-extracted, strong dose |
| High EY, low TDS | Hollow, papery, dry | Over-extracted, weak dose |
| High EY, high TDS | Bitter, astringent, heavy | Over-extracted, strong dose |
Under-extraction happens when water moves through the grounds too quickly or at too low a temperature. The first compounds to dissolve are acids and salts. Without enough contact time, the sweeter, more complex compounds never make it into the cup. The result is a sour, thin brew that lands in the left side of the chart.
Over-extraction happens when contact time is too long or grind is too fine. Water pulls out the desirable compounds first, then continues extracting harsh, bitter phenols and tannins. The brew lands on the right side of the chart with EY above 22%.
Strength problems appear on the vertical axis. A brew can be perfectly extracted at 20% EY but still taste weak if TDS sits at 1.0% because the dose was too small. Conversely, a 1.6% TDS brew feels heavy and overwhelming even at correct EY.
Pro Tip: When a brew tastes sour AND weak, check both axes before adjusting. Sour alone suggests low EY. Sour plus thin suggests low EY and low TDS together, which means both grind size and dose need attention simultaneously.
What are the target ranges for popular brewing methods?
Different brewing methods operate at fundamentally different scales on the extraction chart. Applying filter coffee logic directly to espresso creates confusion because the TDS ranges do not overlap.
Filter methods (V60, Chemex, drip) target 18–22% EY at 1.15–1.35% TDS, using brew ratios between 1:15 and 1:18. Water temperature should sit between 197°F and 205°F. A standard V60 brew at a 1:16 ratio completes in 2:30–3:30 minutes. Finishing faster than 2:30 suggests the grind is too coarse. Finishing slower than 3:30 suggests it is too fine.
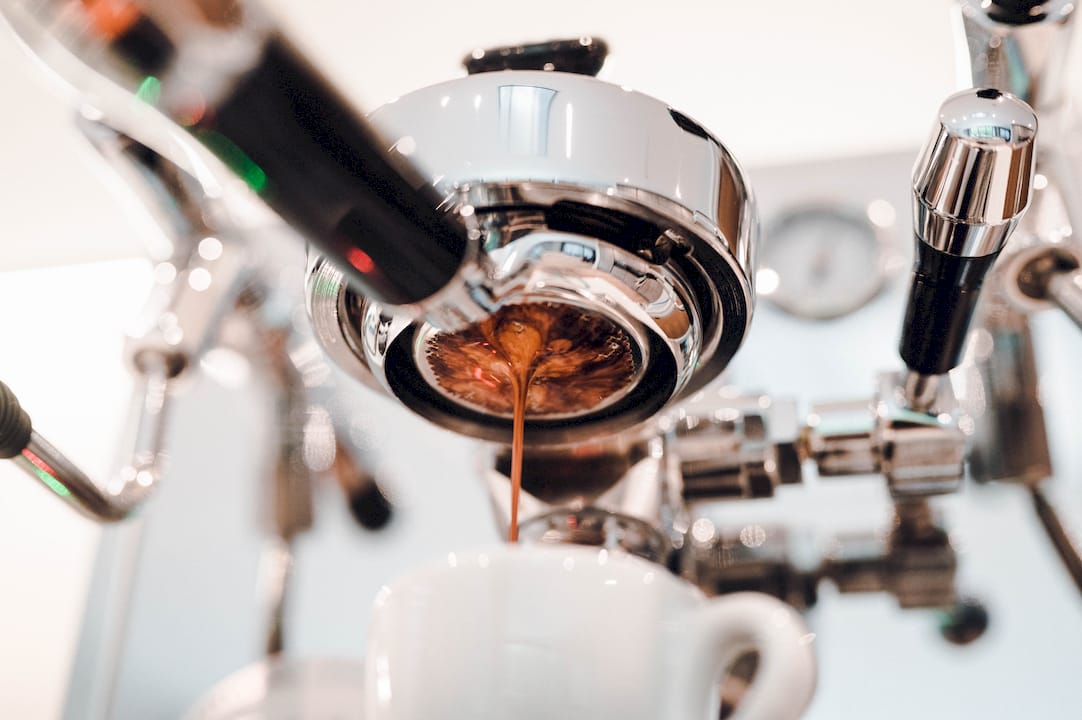
Espresso uses a much higher TDS of 8–12% with extraction yield still targeting 18–22%. The brew ratio runs 1:1.8–1:2.5, and extraction time falls within 25–32 seconds. Espresso’s concentration is what makes it suitable for milk drinks. The chart still applies, but the numbers occupy a completely different region of the grid.
Cold brew extracts over 12–24 hours at room temperature or refrigerator temperature using coarse grounds and ratios between 1:4 and 1:8. The resulting concentrate typically reaches 2.5–4.0% TDS before dilution. Low extraction temperature suppresses acidity, which is why cold brew tastes smoother than hot-brewed coffee at equivalent strength.
French press and AeroPress sit between filter and espresso on the chart. French press typically uses a 1:15 ratio with a 4-minute steep. AeroPress allows significant flexibility, with ratios ranging from 1:6 for concentrate to 1:16 for a filter-style cup.
-
Filter methods: 1:15–1:18 ratio, 1.15–1.35% TDS, 18–22% EY
-
Espresso: 1:1.8–1:2.5 ratio, 8–12% TDS, 18–22% EY
-
Cold brew concentrate: 1:4–1:8 ratio, 2.5–4.0% TDS, 18–22% EY
-
French press: 1:15 ratio, 4-minute steep, medium-coarse grind
-
AeroPress: 1:6–1:16 ratio depending on brew style
How can home brewers use the chart to improve consistency?
Applying the extraction chart at home requires three pieces of equipment: a digital scale, a timer, and a refractometer. The scale handles dose and brew weight. The timer tracks brew time. The refractometer measures TDS directly from a cooled sample of the finished brew.
The workflow follows a clear sequence. Weigh the dry coffee dose before brewing. Record the total brew weight when finished. Measure TDS with the refractometer. Calculate EY using the formula: (beverage weight × TDS%) ÷ dry coffee dose. Plot the result on the chart.
Grind size is the primary variable to adjust when brew time falls outside the target window. If a V60 finishes in under 2:30, grind finer. If it runs past 3:30, grind coarser. Ratio controls strength once extraction is dialed in. Water temperature affects extraction but within a narrower range than grind size.
Common pitfalls include measuring TDS before the brew cools, which inflates readings. Refractometers calibrated for wort or other liquids also give inaccurate coffee readings. Use a refractometer designed for coffee or one with a Brix-to-TDS conversion factor specific to coffee. Another frequent mistake is adjusting grind and ratio at the same time. Change one variable per session so you can isolate the effect.
The chart also reveals when a coffee’s roast level is fighting the brew parameters. Lighter roasts extract more slowly and often need finer grinds or higher temperatures to reach the ideal zone. Darker roasts extract quickly and can tip into over-extraction at the same settings that work for a medium roast. The chart makes these differences visible rather than leaving them as guesswork.
Pro Tip: Multiple paths lead to the same EY. A coarser grind with a longer brew time can hit 20% EY just as reliably as a finer grind with a shorter time. Use this to your advantage when adjusting for roast level or bean density.
Key Takeaways
The coffee extraction chart is a diagnostic tool that maps TDS and extraction yield to identify brewing errors and guide adjustments across all brewing methods.
| Point | Details |
|---|---|
| Chart axes and variables | TDS measures strength; EY measures solubles extracted; brew ratio links both on diagonal lines. |
| Gold Cup target zone | Filter coffee targets 18–22% EY and 1.15–1.45% TDS, but consumer preferences extend beyond this range. |
| Method-specific scales | Espresso operates at 8–12% TDS; filter at 1.15–1.35%; cold brew concentrate at 2.5–4.0%. |
| Adjustment priority | Fix grind size first when brew time is off, then ratio, then water temperature. |
| Chart as starting point | The ideal zone guides diagnosis, but sensory evaluation remains necessary for final brew decisions. |
The chart is a map, not a destination
I have used the Brewing Control Chart for years, and the single most important thing I have learned is that it shows you where you are, not where you must go. Dr. Lockhart built it in the 1950s to bring objectivity to coffee evaluation, and it succeeded at that. But the chart was never meant to define the only acceptable cup.
Recent research confirms what experienced tasters have known for a long time: TDS impacts consumer preference more than extraction yield does. Two cups at identical chart coordinates can taste completely different because of bean origin, roast development, and water mineral content. The chart identifies gross brewing errors with precision. It cannot tell you whether a 19.5% EY Ethiopian natural will taste better to you than a 21% EY Colombian washed. That judgment belongs to your palate.
My advice is to use the chart to eliminate obvious problems first. If a brew tastes sour, check whether EY is below 18% before blaming the beans. If it tastes bitter, check whether EY exceeds 22% before adjusting roast. Once the brew lands in the target zone and still does not satisfy, that is when you start experimenting with ratios, temperatures, and grind profiles beyond the standard recommendations. The chart is the beginning of the conversation, not the end of it.
— Keith E Lyons
Quality beans make chart knowledge count
Understanding the extraction chart gives you the framework. The beans determine the ceiling.
Lyons Den Publishers has curated a selection of coffee bundles specifically for home brewers who want to put extraction theory into practice. Each bundle pairs well-sourced beans with the brewing context you need to apply TDS and EY targets confidently. Whether you brew filter, espresso, or cold brew, the right starting material makes every chart adjustment more meaningful. Visit the Coffee Bundle Sales page at Lyons Den Publishers to find a selection matched to your brewing method and taste preferences. Good extraction starts with good coffee.
FAQ
What is the ideal extraction yield for coffee?
The standard target is 18–22% extraction yield for filter coffee, as defined by the Specialty Coffee Association’s Brewing Control Chart. Recent research shows that consumer preferences can fall outside this range and still produce enjoyable cups.
How long should coffee extraction take?
Brew time depends on the method. A V60 pour-over targets 2:30–3:30 minutes, espresso runs 25–32 seconds, and cold brew extracts over 12–24 hours. Brew time outside the recommended window for a given method signals a grind size adjustment is needed.
What TDS should espresso reach?
Espresso targets 8–12% TDS, which is significantly higher than filter coffee at 1.15–1.45%. This difference means espresso and filter brewing require separate mental models when reading the extraction chart.
How do I calculate extraction yield at home?
Multiply beverage weight by TDS percentage, then divide by dry coffee dose weight. A refractometer measures TDS directly from a cooled brew sample, giving you the number needed to complete the calculation and plot your brew on the chart.
Can a brew taste good outside the ideal chart zone?
Yes. The chart identifies brewing errors but does not define the only acceptable flavor range. Many brewers find satisfying cups at TDS or EY values outside the Gold Cup corridor, particularly when adjusting for personal taste, roast level, or bean origin.